

Close Menu
CryptoDispatchDaily.comCryptoDispatchDaily.com
    What's Hot

    Figure Blockchain Lender Confirms Customer Data Breach Following Social Engineering Attack

    February 18, 2026

    Bitcoin eyes $76,800 ‘breakeven wall’ as macro tailwinds build

    April 16, 2026

    Analyst Predicts Crypto Market Cap Could Hit $100T by 2030

    March 26, 2026
    Facebook X (Twitter) Instagram
    • About Us
    • Contact Us
    • Privacy Policy
    • Terms and Conditions
    Facebook X (Twitter) Instagram
    CryptoDispatchDaily.comCryptoDispatchDaily.com
    • News

      Scott Bessent Says Stablecoins Could Strengthen US Dollar Dominance and Treasury Demand

      October 31, 2026

      XRP Ledger adds Flare to validator list as Anodos steps down

      October 28, 2026

      Galaxy Digital Shares Rise Following $323M Q3 Profit, New $200M Buyback Plan

      October 27, 2026

      Ripple Prime Brings Round-the-Clock RWA Swaps Into Institutional Trading

      October 26, 2026

      1win Token Explained: Tokenomics, Sale Commitments, Vesting, Utility and Buybacks

      October 25, 2026
    • Technology

      Hoskinson flags Binance sweeper code in EIP-7702 debate

      October 31, 2026

      ENS DAO Approves ENSv2 With 1.69M Votes, Execution Due October 27

      October 29, 2026

      Chainlink Expands RWA Tools as LINK Price Tests Key Support Zone

      October 28, 2026

      Why is Bitcoin price down today? BTC slips below $80K ahead of Fed decision

      October 26, 2026

      The On-Chain Check on NEAR’s $8M Buyback: What the Receipts Actually Prove

      October 24, 2026
    • Learn/Guide

      Can You Recover Stolen Crypto? Key Statistics and Facts for 2026

      October 31, 2026

      How to Cash Out Crypto to a Bank Account: Statistics and Costs for 2026

      October 30, 2026

      Is Crypto Safer Than a Bank? Key Statistics for 2026

      October 29, 2026

      Can Bitcoin Make You Rich in 10 Years? What the Maths Says

      October 28, 2026

      Crypto Staking Statistics 2026: Can You Live Off Staking Rewards?

      October 27, 2026
    • Regulation

      WLFI’s Staking Pool Grew 51% in 16 Days, but the Reward Pool Is Now Draining Faster

      October 31, 2026

      Ripple and Robinhood Expand RLUSD for Institutional Settlement

      October 29, 2026

      17,332 Solana Programs Need a Rebuild Before Their Next Upgrade

      October 28, 2026

      Bank of Israel Rejects Netanyahu Blockchain Sanctions Plan Bid

      October 26, 2026

      How One Wallet Bought Arkadiko’s DAO for $51K and Drained $1.09M

      October 25, 2026
    • Live Pricing Chart
    CryptoDispatchDaily.comCryptoDispatchDaily.com
    Home » Sui Price Shows Fresh Buy Signal as Network Growth Meets Unlocks
    Technology

    Sui Price Shows Fresh Buy Signal as Network Growth Meets Unlocks

    September 14, 20264 Mins Read
    Facebook Twitter Pinterest LinkedIn Tumblr Email
    Sui Price Shows Fresh Buy Signal as Network Growth Meets Unlocks
    Share
    Facebook Twitter LinkedIn Pinterest Email


    TLDR:

    • Sui price receives a fresh TD Sequential buy signal after the prior setup preceded a 17% rally and momentum shift on the 12-hour chart.
    • SUI trades near $0.72 while the $0.71-$0.73 zone holds focus, with a break below $0.71 exposing the $0.62-$0.63 range for SUI.
    • Institutional access expands through the TSUI spot ETF and CME futures, but monthly unlocks and declining DeFi TVL add supply pressure.
    • Sui network data shows stablecoin market capitalization above $457 million and more than 16.17 billion lifetime transactions.

    The Sui price trades near $0.72 as analyst Ali Martinez identifies a TD Sequential buy signal on the 12-hour chart. CoinMarketCap lists SUI at $0.7187 at the latest reading, with a 24-hour range between $0.7063 and $0.7305. Martinez says the indicator previously preceded a 17% rally and a shift in momentum. 

    The Sui crypto price tests the $0.71-$0.73 support area after the signal. A break below $0.71 could expose $0.62-$0.63. A recovery toward $0.85 could place $1 back in focus. The setup combines a bullish indicator with supply and leverage risks across the Sui market.

    Sui Coin Price

    Sui Price Buy Signal Meets a Key Support Zone Test

    Ali Martinez describes the TD Sequential as relatively accurate at identifying major trend shifts in SUI’s recent 12-hour chart history. He says the previous SUI buy signal appeared after a 17% rally and anticipated the next momentum change.

    SUI: BUY SIGNAL

    The TD Sequential has been remarkably accurate at identifying major trend shifts on SUI’s 12-hour chart.

    Its previous signal came after a 17% rally and accurately anticipated the next shift in momentum.

    Now, with $SUI trading near $0.71, the indicator has… https://t.co/LZlgzi5VZE pic.twitter.com/1b1SzQSB1r

    — Ali Charts (@alicharts) September 13, 2026

    TD Sequential tracks price sequences to identify possible trend exhaustion. A completed buy setup can point to a reversal, but it does not confirm a new trend.

    The Sui price now tests the lower boundary of a key trading area. Ali Charts places support between $0.71 and $0.73. A daily close below $0.71 could open a path toward $0.62-$0.63.

    An earlier Ali Charts post described SUI as moving inside a channel with a lower boundary near $0.71. That post placed the upper channel target near $0.84.

    Michaël van de Poppe also suggests the support could retest to hold. He says a recovery toward $0.85 could place levels above $1 back into focus.

    A full retest of this support area for $SUI, which I’d like to see hold.

    If that does happen and it grinds back to $0.85, very likely we’ll start to see numbers above $1.

    Remaining positive on this one. pic.twitter.com/aCSuyPWnJI

    — Michaël van de Poppe (@CryptoMichNL) September 13, 2026

    SUI’s market structure adds another risk factor. The analysis reports futures activity exceeding spot trading. That pattern can amplify moves through liquidations when leveraged positions unwind.

    The indicator points to a possible reversal, while support decides whether buyers defend the setup.

    Sui Price Outlook Faces ETF Demand and Token Unlocks

    Regulated market access has expanded through the 21Shares Sui ETF, which trades on Nasdaq under the TSUI ticker. The product provides spot SUI exposure and may stake part of its holdings.

    21Shares began TSUI trading on February 24, 2026. CME Group also lists SUI and Micro SUI futures after launching the contracts in May.

    These instruments create routes for institutional exposure, hedging, and price discovery. They do not confirm sustained inflows, and no latest ETF flow figures appear in the analysis.

    The ETF offers exposure without direct wallet custody. That broadens the set of market participants tracking SUI.

    Network activity provides a separate growth measure. Sui surpassed 16.17 billion lifetime transactions by September 13. Its stablecoin market capitalization also moved above $457 million.

    DeFiLlama currently lists Sui stablecoins at $463.67 million, up 8.85% over seven days. According to DeFiLlama data, the total DeFi TVL is at $457.13 million.
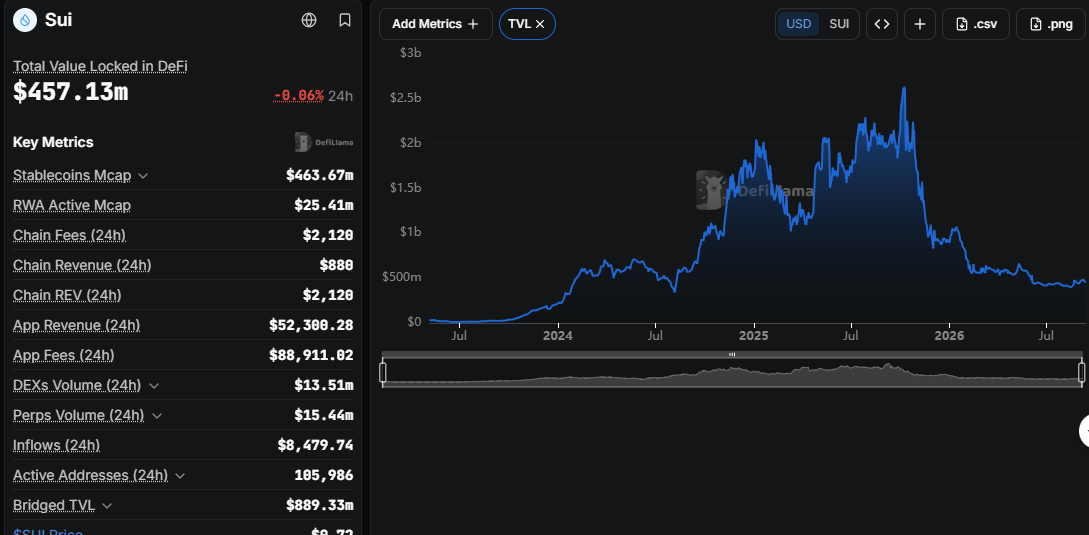
    Source: DeFiLlama

    Stablecoin growth can support trading activity and collateral demand. It does not guarantee lasting token demand; capital can leave quickly during market stress or shift toward other competing networks.

    USDC accounts for about 63.88% of the stablecoin market capitalization. Other assets include Sui Dollar, FDUSD, BUCK, USDY, suiUSDe, and USDT.

    That concentration leaves the network’s liquidity profile heavily tied to one asset. The current figures show USDC carrying most of the stablecoin balance.

    Supply growth pressures the Sui price. Monthly unlocks of roughly 64 million SUI add tokens to circulation. The analysis also flags declining DeFi TVL as a pressure point.

    The Sui price must absorb fresh supply while network liquidity and institutional access develop. CoinMarketCap lists a 10 billion maximum supply and a circulating supply near 4.09 billion.

    Futures leverage adds another variable to the near-term chart. A daily close below $0.71 would put the $0.62-$0.63 range back into focus.



    Source link

    Share. Facebook Twitter Pinterest LinkedIn Tumblr Email

    Related Posts

    Hoskinson flags Binance sweeper code in EIP-7702 debate

    October 31, 2026

    ENS DAO Approves ENSv2 With 1.69M Votes, Execution Due October 27

    October 29, 2026

    Chainlink Expands RWA Tools as LINK Price Tests Key Support Zone

    October 28, 2026

    Why is Bitcoin price down today? BTC slips below $80K ahead of Fed decision

    October 26, 2026
    Top Posts

    Ethereum and Solana Led Crypto Hack Losses in H1 2026, Blockaid Says

    July 28, 2026

    A look at the altcoins whales are watching this month

    March 8, 2026

    New Group To Forge Global Blockchain Transaction Standard

    February 18, 2026

    Welcome to CryptoDispatchDaily.com! Your go-to source for fast, reliable updates from the ever-evolving world of cryptocurrency. Whether it's Bitcoin, altcoins, blockchain breakthroughs, or DeFi trends, we bring you timely insights, expert analysis, and key developments shaping the future of digital finance. Stay ahead with real-time crypto news and in-depth coverage.

    Top Insights

    Scott Bessent Says Stablecoins Could Strengthen US Dollar Dominance and Treasury Demand

    October 31, 2026

    XRP Ledger adds Flare to validator list as Anodos steps down

    October 28, 2026

    Galaxy Digital Shares Rise Following $323M Q3 Profit, New $200M Buyback Plan

    October 27, 2026
    Advertisement
    • About Us
    • Contact Us
    • Privacy Policy
    • Terms and Conditions
    © 2026. Designed by CryptoDispatchDaily.com.

    Type above and press Enter to search. Press Esc to cancel.