
Ever looked at a price chart and wondered, “Where is this market going next?” You’re not alone. Every trader, whether new or experienced, faces this question daily. The good news? There’s a simple yet powerful tool that can help you make sense of price movements – trend lines and channels.
Mastering these tools can be the difference between making confident trades and feeling lost in a sea of candlesticks. So, let’s break it down step by step in an easy-to-follow, no-nonsense way.
Understanding Trendlines: The Basics
Think of trendlines as your market GPS. They help you see the overall direction of price movements. A trendline is simply a straight line that connects two or more price points and extends into the future. This gives you a rough idea of where the market might be headed.
There are three types of trends:
- Uptrend (Higher Highs & Higher Lows)
- Downtrend (Lower Highs & Lower Lows)
- Sideways Trend (No clear direction)
Let’s break each one down.
Uptrend: When Prices Keep Rising
An uptrend means the market is moving higher. To draw an uptrend line:
- Identify two or more higher lows.
- Connect them with a straight line.
- Extend the line to the right.
This trendline acts as a support level – meaning prices tend to bounce off it instead of breaking through it.
Example:
Imagine Bitcoin is trending up. On your chart, you notice that it keeps bouncing at higher price points, like $30,000, then $32,000, then $35,000. If you draw a line connecting those points, you have an uptrend line. As long as the price respects this trendline, the uptrend is intact.
Downtrend: When Prices Keep Falling
A downtrend is the opposite. Prices are making lower highs and lower lows. To draw a downtrend line:
- Identify two or more lower highs.
- Connect them with a straight line.
- Extend it to the right.
This trendline acts as a resistance level – meaning prices struggle to break above it.
Example:
Let’s say Ethereum is dropping. It falls from $2,500 to $2,200, then bounces to $2,400 but drops again to $2,000. If you connect these lower highs, you’ll have a downtrend line. As long as prices stay below this line, the downtrend remains strong.
Sideways Trend: When the Market Is Indecisive
Sometimes, prices don’t make higher highs or lower lows. They move in a range, bouncing between support and resistance levels. No clear uptrend or downtrend – just a waiting game until the market picks a direction.
Example:
If a stock is fluctuating between $100 and $120, but not breaking out, it’s in a sideways trend. Traders often wait for a breakout before making a move.
Channels: Trendlines with a Bonus
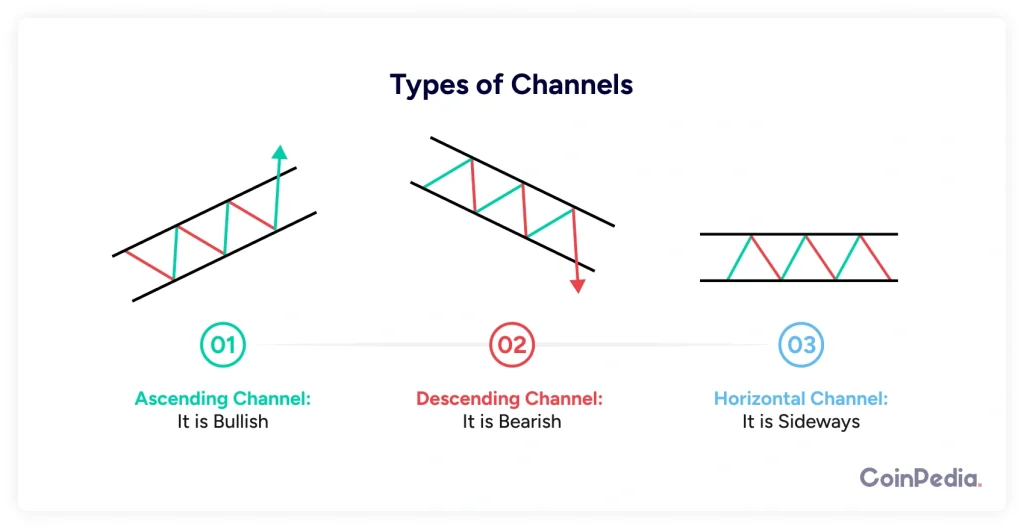
Now that you know trendlines, let’s take it a step further – channels. Channels are like trendlines but with an extra line that runs parallel. This helps traders identify both support and resistance in a trending market.
There are three types of channels:
- Ascending Channel (Bullish)
- Descending Channel (Bearish)
- Horizontal Channel (Sideways)
Ascending Channel (Price Moves Up Within a Range)
To draw an ascending channel:
- Draw an uptrend line (support).
- Add a parallel line above it (resistance) connecting the highs.
Prices will usually bounce between these two lines, giving you trade opportunities.
Example:
If Tesla’s stock price keeps moving up but within a defined range, bouncing off two parallel lines, that’s an ascending channel. Traders can buy near the lower trendline (support) and sell near the upper trendline (resistance).
Descending Channel (Price Moves Down Within a Range)
A descending channel works the same way, just flipped.
- Draw a downtrend line (resistance).
- Add a parallel line below it (support) connecting the lows.
Prices will bounce between these two lines as long as the trend continues.
Example:
If a crypto coin like Solana is in a bearish trend but bouncing off two parallel lines, it’s in a descending channel. Traders can sell near resistance and buy near support if they’re looking for a short-term trade.
Horizontal Channel (Sideways Market with Clear Boundaries)
A horizontal channel is when prices move sideways but stay within a defined range.
- Draw a horizontal support line at the lows.
- Draw a horizontal resistance line at the highs.
Example:
If Apple stock fluctuates between $150 and $170, bouncing off both levels, it’s in a horizontal channel. Traders wait for a breakout before making big trades.
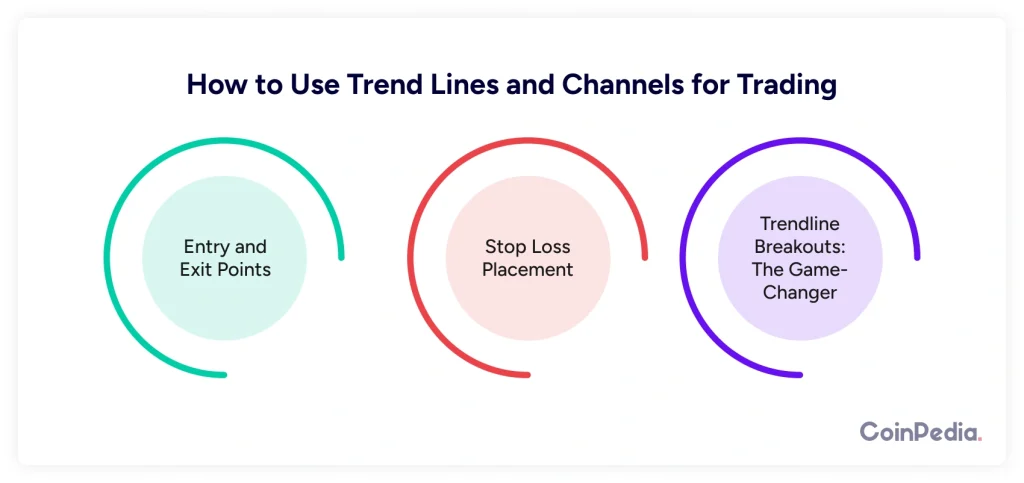
How to Use Trendlines and Channels for Trading
Now that you understand trend lines and channels, let’s discuss how to use them for trading.
1. Entry and Exit Points
- Buy near trendline support in an uptrend.
- Sell near trendline resistance in a downtrend.
- In channels, trade within the range or wait for a breakout.
2. Stop Loss Placement
Always place a stop-loss slightly beyond the trendline. If the trendline breaks, the trend might be reversing, and you want to cut losses quickly.
Example:
If you’re buying Bitcoin near an uptrend line at $40,000, place a stop-loss at $39,500 in case the trend fails.
3. Trendline Breakouts: The Game-Changer
When price breaks through a trendline, it often signals a trend reversal or a strong continuation.
- If price breaks above a downtrend line, it could be a bullish reversal.
- If price breaks below an uptrend line, it might turn bearish.
Example:
If Ethereum has been in a downtrend but suddenly breaks above the trendline, it may signal the start of a new uptrend. Smart traders wait for confirmation before jumping in.
Common Mistakes to Avoid
- Forcing a Trendline – If the line doesn’t fit, don’t force it. It should be clear and obvious.
- Ignoring Multiple Touchpoints – A valid trendline should connect at least two or three points.
- Trading Against the Trend – If the market is trending, don’t fight it. Follow the directions.
- Not Adjusting as Needed – Markets evolve. If a trendline is no longer valid, redraw it.
Final Thoughts: Mastering Trendlines & Channels
Trendlines and channels are like a trader’s best friend. They simplify price movements and give you a clear roadmap of what’s happening in the market. The key is to practice drawing them on real charts. The more you do it, the better you’ll get.
Also read: Engulfing Candlestick Patterns: How to Spot and Trade Market Reversals
FAQs
Identify two or more highs (for downtrend) or lows (for uptrend), connect them with a straight line, and extend it to project future price movement.
A trendline shows a single support or resistance level, while a channel consists of two parallel trendlines indicating both support and resistance zones.
Trendlines help traders identify market direction, entry and exit points, and potential reversals by acting as dynamic support or resistance levels.
A trendline breakout signals a potential trend reversal or continuation. A break above resistance is bullish, while a break below support is bearish.
Trendlines are effective but work best with confirmation from other indicators. Adjust them as the market evolves and avoid forcing trendlines to fit data.