
Have you ever looked at a trading chart filled with lines, clouds, and colors and thought, “What in the world is this mess?” If so, you’re not alone. The Ichimoku Cloud is one of those indicators that can look complicated at first glance. But once you understand it, it can become a game-changer in your trading strategy.
In this guide, we’ll break it down step by step. No fancy jargon, no confusing math—just a simple explanation of what the Ichimoku Cloud is, how to use it, and its pros and cons. Ready? Let’s dive in!
What Is Ichimoku Cloud?
The Ichimoku Cloud, also known as Ichimoku Kinko Hyo (which means “one glance equilibrium chart” in Japanese), is a technical analysis tool that helps traders identify trends, support and resistance levels, and potential trade opportunities.
It was developed by Goichi Hosoda, a Japanese journalist, in the 1930s. He wanted a single indicator that could provide a complete picture of market conditions. And that’s exactly what the Ichimoku Cloud does—it gives you everything you need in one look (or at least, after a bit of practice).
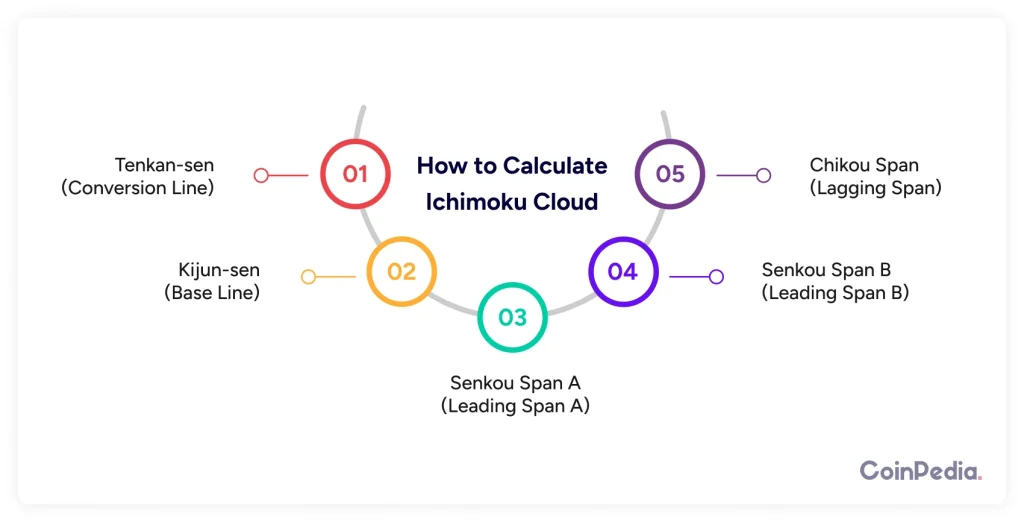
How to Calculate Ichimoku Cloud?
Now, let’s break down the five components of the Ichimoku Cloud. Don’t worry—we’ll keep the math simple!
- Tenkan-sen (Conversion Line)
- Formula: (9-period high + 9-period low) ÷ 2
- This gives a short-term trend indicator, similar to a moving average.
- Kijun-sen (Base Line)
- Formula: (26-period high + 26-period low) ÷ 2
- This acts as a medium-term trend indicator and can signal potential trend reversals.
- Senkou Span A (Leading Span A)
- Formula: (Tenkan-sen + Kijun-sen) ÷ 2 (plotted 26 periods ahead)
- This forms one edge of the cloud and represents potential support/resistance levels.
- Senkou Span B (Leading Span B)
- Formula: (52-period high + 52-period low) ÷ 2 (plotted 26 periods ahead)
- This forms the other edge of the cloud.
- Chikou Span (Lagging Span)
- Formula: Current closing price plotted 26 periods back.
- This helps confirm trends by showing where the price stands in relation to past movements.
Once these lines are plotted, they create the famous “cloud”—a shaded area between the Senkou Span A and Senkou Span B lines.
What Does the Ichimoku Cloud Tell You?
The best part about the Ichimoku Cloud? It tells you a lot of useful things at a glance.
1. Trend Direction
- If the price is above the cloud, the trend is bullish.
- If the price is below the cloud, the trend is bearish.
- If the price is inside the cloud, it’s in a range or consolidation.
2. Support and Resistance
The cloud acts as a dynamic support or resistance zone. If the price is above the cloud, the cloud itself can serve as support. If below, it can act as resistance.
3. Momentum Signals
- When the Tenkan-sen crosses above the Kijun-sen, it’s a bullish signal.
- When the Tenkan-sen crosses below the Kijun-sen, it’s a bearish signal.
- When the Chikou Span is above price, it confirms an uptrend. Below? Downtrend.
4. Future Trend Projections
Since the cloud is plotted 26 periods ahead, it gives an idea of where support and resistance might be in the future.
Example: Using Ichimoku in a Trade
Imagine you’re looking at Bitcoin’s price. It has just crossed above the cloud, the Tenkan-sen is above the Kijun-sen, and the Chikou Span is above price. What does this tell you?
This suggests a strong uptrend, meaning it could be a good time to consider a long trade (buying Bitcoin). If the price were below the cloud, it would be the opposite—a potential short trade.
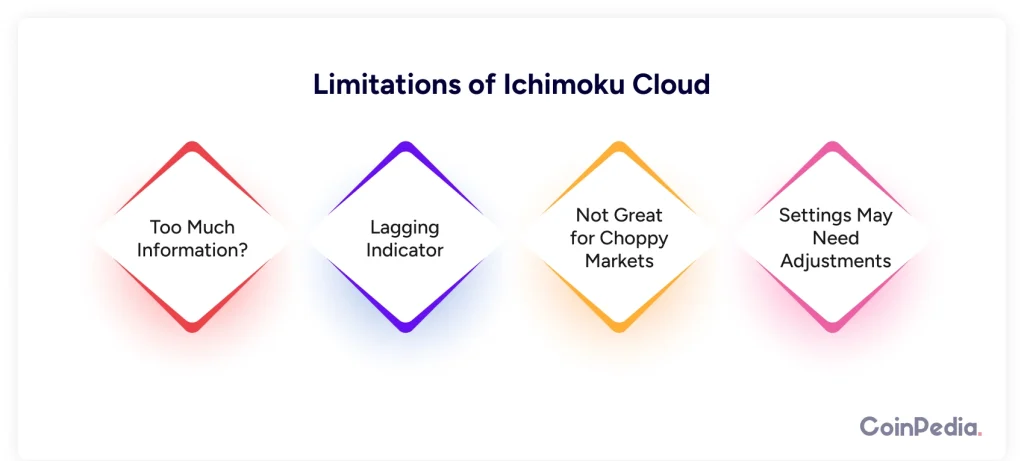
Limitations of Ichimoku Cloud
No indicator is perfect, and the Ichimoku Cloud is no exception. Here are a few things to watch out for:
- Too Much Information?
- Some traders find it overwhelming, especially with all the lines on the chart.
- Lagging Indicator
- Since it uses past price data, it may not always react quickly to sudden market changes.
- Not Great for Choppy Markets
- In sideways or ranging markets, the signals can be misleading.
- Settings May Need Adjustments
- The default settings (9, 26, 52) were designed for the Japanese stock market in the 1930s. Crypto or forex traders sometimes tweak these values for better results.
Also Read: Death Cross Explained: What It Means for Stocks & Crypto Markets
Final Thoughts: Is Ichimoku Cloud Right for You?
If you like a clear, visual approach to trading, the Ichimoku Cloud is worth mastering. It’s powerful, providing trend direction, momentum signals, and future projections all in one.
But like any tool, it works best when combined with other indicators and a solid trading strategy. So, before you jump in, practice on a demo account and get comfortable reading the signals.
Once you do, you’ll start to see the market in a whole new way—just like Goichi Hosoda intended.
FAQs
The Ichimoku Cloud is a trading indicator that shows trend direction, support/resistance, and momentum using five key components for better decision-making.
If the price is above the cloud, it’s bullish; below the cloud is bearish. The cloud itself acts as support/resistance, and crossovers signal trend changes.
It’s both—some elements lag (like the Chikou Span), while others project future trends (like Senkou Span A & B), making it a comprehensive trading tool.
While powerful, it’s best combined with other indicators like RSI or MACD to confirm signals and reduce false breakouts in choppy markets.
Trust with CoinPedia:
CoinPedia has been delivering accurate and timely cryptocurrency and blockchain updates since 2017. All content is created by our expert panel of analysts and journalists, following strict Editorial Guidelines based on E-E-A-T (Experience, Expertise, Authoritativeness, Trustworthiness). Every article is fact-checked against reputable sources to ensure accuracy, transparency, and reliability. Our review policy guarantees unbiased evaluations when recommending exchanges, platforms, or tools. We strive to provide timely updates about everything crypto & blockchain, right from startups to industry majors.
Investment Disclaimer:
All opinions and insights shared represent the author’s own views on current market conditions. Please do your own research before making investment decisions. Neither the writer nor the publication assumes responsibility for your financial choices.
Sponsored and Advertisements:
Sponsored content and affiliate links may appear on our site. Advertisements are marked clearly, and our editorial content remains entirely independent from our ad partners.